Capture UI & requests
Capture combines client tabs, a request list, and a detail pane—compare raw vs script-shaped payloads and tie into breakpoints and resend debug.
Client tabs
Tabs are keyed by source IP: one tab per proxied client. Reorder by drag-and-drop; newly seen IPs are appended at the end (order does not follow request arrival jitter).
- Labels usually show the client IP; loopback/localhost may read as a localized “this machine” style label.
- Closing a client tab clears that IP’s rows from the capture list and hides the tab; forwarding through the proxy is unchanged—only UI state and loaded list data.
- Different phones on the same Wi‑Fi, or multiple containers/VMs on one PC, appear in different tabs whenever their source IPs differ.
- When no client tab is available, the list may show all loaded sessions without a single-IP filter—follow what the running app shows.
Request list
The left column lists sessions for the current context: first scoped by the active client tab, then shaped by tree layout, sort order, and the filters below.
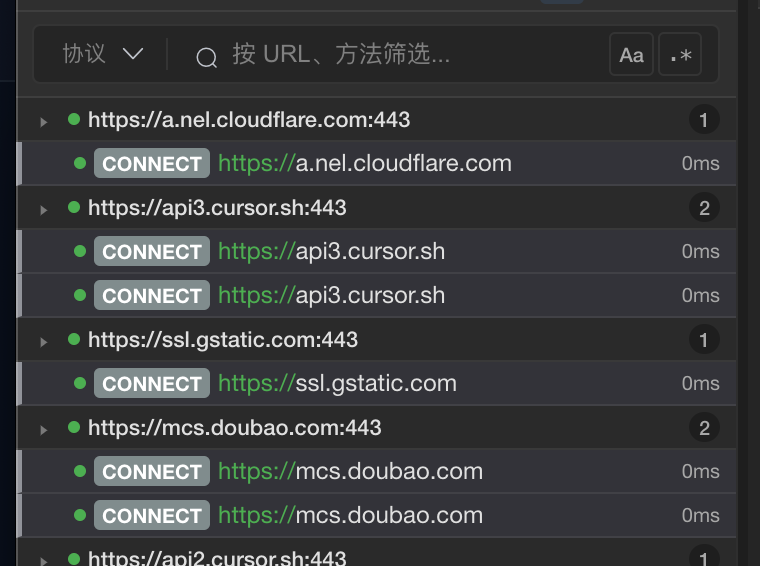
Tree layout
Group rows by protocol plus host; click group headers to collapse or expand. The tree toggle can be persisted in-app.
Two views of the same list area: flat rows on the left, tree grouping on the right (shown side by side for comparison; in the app you toggle between modes).
Sort
Default is newest-first; toggle oldest-first from the list header. Sorting uses capture timestamps, with an embedded per-millisecond sequence in the request id as a tie-break. Sort runs after filters.
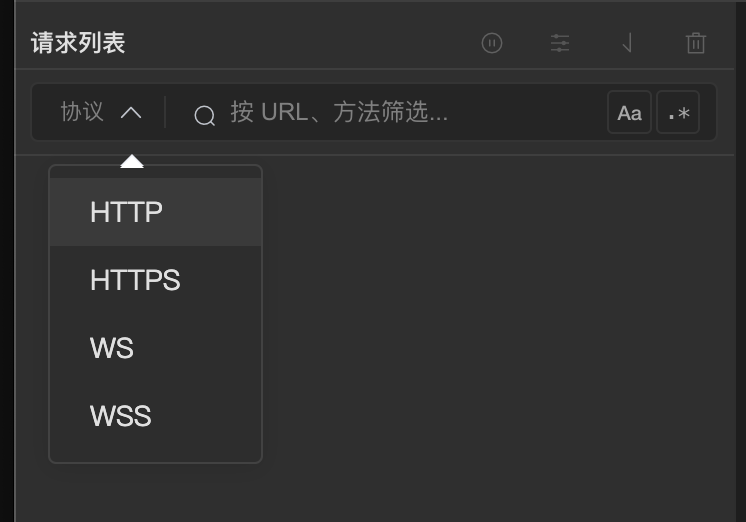
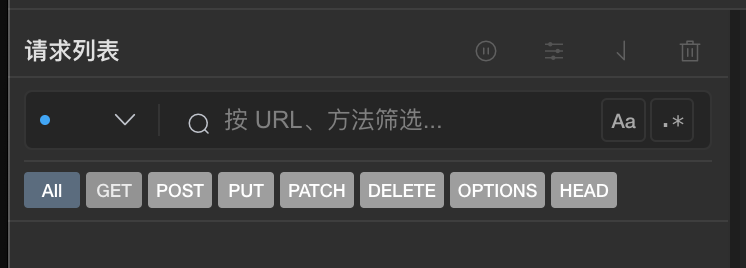
Filter
Multi-select protocols (HTTP, HTTPS, WS, WSS, …). When HTTP/HTTPS is selected, you can narrow further by method (GET, POST, …). The keyword matches URL text, method, host, and script-related preview fields; use Aa for case and .* for regex. Empty matches show a hint to relax filters. Filtering applies on top of the client subset from the active tab.
Below left: protocol chips you can toggle together. Below right: when HTTP or HTTPS is checked, the per-method sub-filter appears and combines with the protocol chips.
Clear vs close tab
The trash/clear action (when enabled) clears server-side rows for the selected client only and does not hide the tab. The × on a tab clears that client and hides the tab; traffic from that IP may recreate the tab later.
Recording, capture view, and SSL
The master “proxy recording” switch decides whether new sessions are written to the list (when off, new rows and breakpoint-related ids are usually not created). Traffic can still be forwarded transparently. With SSL interception on and the host allowlisted, HTTPS is MITM’d and bodies are visible. With SSL off or not allowlisted, HTTPS often stays a CONNECT tunnel; you may only see a tunnel row with copy stating the payload was not decrypted. Being on the Capture screen vs elsewhere is independent of recording: leaving Capture usually disables the global script/breakpoint chain, but recording can still append sessions if left on.
Per-client list pause
Available when a specific client tab is selected. While paused, that client skips request/response breakpoints (still forwarded). The UI may drop incoming pushes for that IP so new rows do not appear—behavior vs the main process store can vary by build; trust the app you installed.
Insert order and scrolling
New sessions usually land at the top (newest first). If you have scrolled down, the list tries to preserve the viewport using an anchor when rows grow at the top; at scrollTop 0 it typically does not compensate. When a breakpoint needs attention, the list scrolls the paused row into view. The detail pane has no equivalent anchor logic.
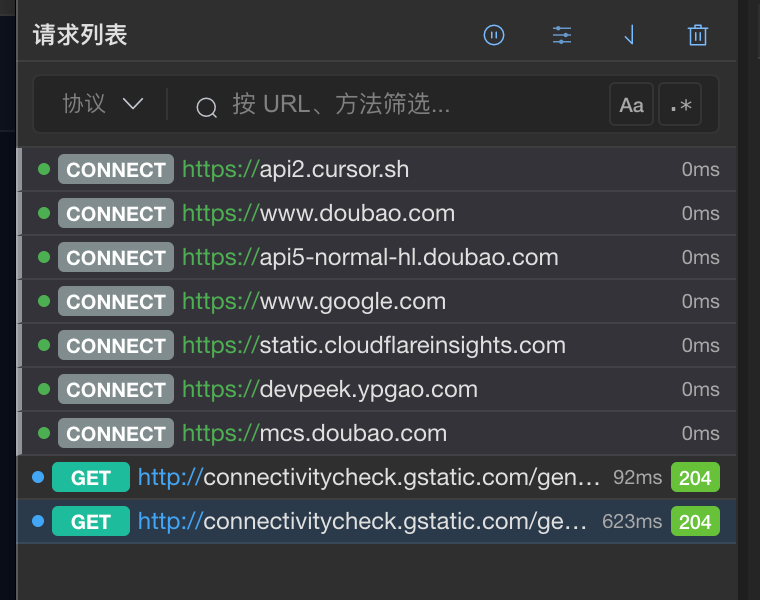
Row chrome
Colored dot: application protocol (HTTP, HTTPS, WS, WSS—commonly blue/green/orange/purple).
Method badge: colored HTTP verb (GET, POST, …).
Status badge: shown when a status code exists; color hints 2xx / 3xx / 4xx / 5xx bands.
Left bar: orange means paused on a breakpoint (continue/abort); gray means an in-flight/interrupted-looking row without a status yet (and not paused), or a breakpoint flow closed out. Completed rows may have no colored bar. In tree mode, leading blank space is indentation, not status.
Detail pane (capture)
With a row selected, the right pane shows that session. Breakpoint banners (request paused, response paused, or closed-with-reason) render above the main tabs when applicable—see Global scripts & breakpoints; below them are five fixed top-level tabs and their bodies.
Layout and action bar
When a session is selected, a “resend / debug send” control can appear at the top of the detail column, opening the side drawer prefilled from the current row (same capability as list shortcuts).
Detail content lives in its own scroll container. Unlike the list’s “anchor the viewport when new rows insert at the top”, the detail pane does not auto-scroll to the top when you pick another request—so you can keep a similar scroll depth while skimming. Scroll to the top yourself when you want a fresh view.
Five top tabs and “no surprise jumps”
The top tabs are always: Overview, Request headers, Request body, Response headers, Response body (exact labels follow your build). The active top tab is stored on the capture home state: when you click different rows in the list, the app does not reset you back to Overview—you stay on, say, Response body so you can compare payloads across sessions in the same slot.
Only corrupted local state (an unknown tab name) falls back to Overview; normal browsing will not bounce you across the five tabs by itself.
- Overview: compact metrics (next section).
- Request / response headers: formatted blocks, raw vs script-shaped compare, breakpoint editing (see Headers).
- Request / response bodies: inner tabs for preview, raw text, script-shaped output, tamper editor (see Bodies).
Overview (shared metrics)
Overview uses a two-column table so, with the top tab pinned here, you can quickly scan client IP, method, host, colored status, timing, and the full URL when hopping across rows:
- Client IP: traffic source; loopback may read as a localized “this machine” label.
- HTTP method: matches list badges.
- Host: aligns with the URL host for cross-checks with list filters.
- Status: colored bands for 2xx / 3xx / 4xx / 5xx, distinct styling for abort-like outcomes, placeholder when no final code yet.
- Duration: prefers server-reported elapsed ms; otherwise derives from completion vs first-byte timestamps; shows an em dash when unknown. Long URLs wrap with word-break.
Request and response headers
Read-only mode shows monospace “Header: value” lines. Array values (typical for multiple Set-Cookie) expand to repeated keys—one line per cookie—for easier copy/audit.
When a raw header snapshot exists and the row is marked script-processed on that axis, Original vs Processed inner tabs appear; Processed can expose a Script log shortcut with phase-tagged console output (aligned with the four global script hooks).
If neither side has text, you see an empty state; if only one side exists, the UI may collapse to a single pane without dual tabs. Inner selection clamps when one side disappears.
On an editable breakpoint pause, the header area becomes a large textarea: tamper line-by-line (first colon splits key/value) before Continue/Abort on the banner.
Request and response bodies (inner tabs)
Inner tabs appear as needed: tamper editor (breakpoint only), Preview (Content-Type plus heuristics for JSON/XML/HTML, forms, multipart…), Raw text, and Processed when both a snapshot and script shaping exist. Processed can also surface Script log.
Request body: inner tab choice is clamped only when the active inner tab is no longer available for the newly selected row; otherwise your habit (e.g. staying on Raw) tends to persist across selections—good for byte-level comparisons across requests.
Response body: each time you select another row, the inner tab resets by priority Preview → Raw → Processed (skips missing panes). This is intentional—HTML/JSON responses are easier to read in Preview first. For strict raw comparisons across rows, pick the row then click Raw again; it stays while each row still offers that tab.
Request preview keys off Content-Type and light sniffing; response preview supports a broader MIME allowlist (JSON, JS/CSS, XML/HTML, Markdown/YAML, plain text, data:image/…, etc.). Multipart and editor formatting follow in-app behavior.
When none of edit/preview/raw/processed applies, the whole section shows an empty state.
- Request body shows the primary payload used in capture details, with optional contrast to the raw snapshot after scripts run; breakpoint mode prioritizes the tamper editor.
- Response body follows the same snapshot vs shaped split; data:image/ URLs may preview inline.
Tips for comparing many requests
Combine “top tab stays put” with Overview metrics:
- Latency sweep: pin Overview, click rows, read duration + status colors only.
- JSON bodies: pin Request body on Raw or Preview; clamps only if a row lacks that view.
- HTML/JSON responses: pin Response body; accept the per-selection Preview default, or switch to Raw once per comparison batch for byte-identical reads.
Breakpoint banner
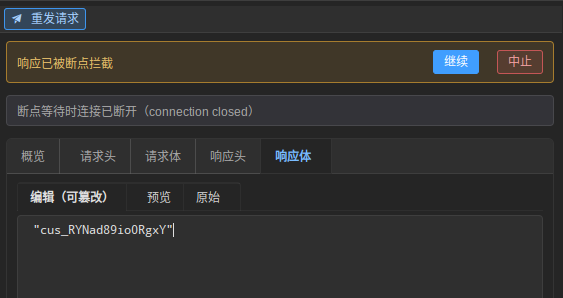
When a request/response is paused on a breakpoint, a banner offers Continue to continue with edits or Abort to drop the session.
When a breakpoint pauses a session, an amber banner appears at the top of the detail pane (wording differs for request vs response phase) with Continue and Abort on the right. Headers/bodies switch to editable inner tabs such as Edit (tamper). If the client disconnects while waiting, a gray reason line is shown below.
Detail top tab when a breakpoint hits
When a row enters **request-phase** breakpoint pause, the app selects it, scrolls it into view in the list, and switches the **top** detail tab to **Request body** if any displayable body exists (including text captured from the original snapshot); otherwise **Request headers**. **Response-phase** pause does the same with **Response body** vs **Response headers**. If both request and response pause flags were ever true on one row (rare), **request phase wins** so you finish tampering upstream first.
Manually clicking another row that is still paused applies the same top-tab alignment so you land directly on headers/body editing. Rows that are not paused do **not** force a top-tab change (the general “switch rows without resetting the top tab” behavior still applies).
Rule library, activation, and “multiple rules”
The breakpoint library can store many entries, but the proxy loads **only the one rule ticked under Proxy → Start breakpoint** at a time—there is no “OR match many library rules and show multiple hits side by side” mode. The evaluator walks the passed-in list **in order** and returns the **first** matching rule plus any script `handle` result; in current builds that list has **at most one** entry, so each pause maps to that active rule’s match/handle. Req/Res toggles, auto-breakpoint tamper, and script-rule semantics are covered in the global scripts & breakpoints guide.
Focus after Continue / Abort
After **successful** Continue or Abort on the banner, the app searches the list **scoped to the current client tab** for another row still in request or response pause: scan **downward from the row below the one you just handled** to the end, then from the **top of the list** up to just before that row (wrap-around), respecting the current sort order (newest-first or oldest-first).
If a paused row is found: switch client tabs when needed, select it, scroll it into view, and re-apply the top-tab rules from the previous section. If none remain paused: selection stays on the row you just finished; the top tab is not forced to change.
If the resend drawer is open when a new pause arrives, auto-select/scroll is deferred until the drawer closes; when that runs, the same top-tab alignment applies.
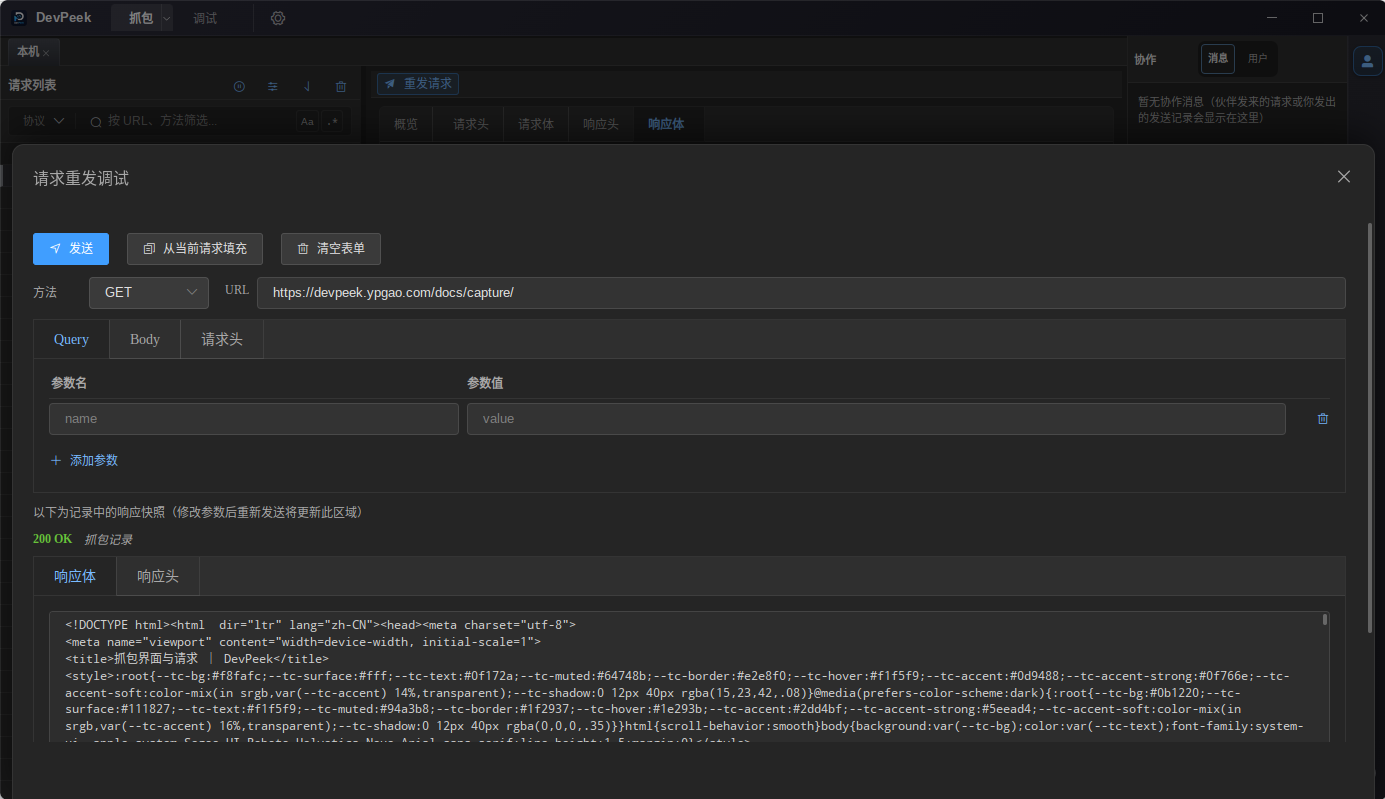
Resend / debug send
Resend request at the top of the request detail pane is for quick API debugging: open the bottom drawer prefilled from the current request with URL, query, method, and headers. Bodies can be none, JSON, text, form, multipart (text/file), or raw file. CONNECT or undecrypted tunnels may block send with an inline reason. The drawer shows the latest response snapshot; resend updates it.
Open the bottom drawer from Resend request in the detail column or from the list context menu. Edit method, URL, query, body, and headers, then send via the main process (bypassing browser CORS). The first open shows the captured response snapshot; each resend refreshes the result area below.