
Why We Built DevPeek
Why We Built DevPeek (2): That H5 Page in the App—Debug It on Your PC
Login worked. The activity page did not.
In part one, param transform turned encrypted bodies into “edit the field, hit send.” QA confirmed staging login. Then product dropped another line:
“The activity button does not tap on Android—iOS is fine. Can you take a look?”
Not a dead API. GET /api/activity/config was 200 in capture; Mock looked fine too. The issue was the H5 page embedded in the App: same URL looked OK in Chrome’s responsive mode, but on a real WebView the button sat under the bottom safe area—untappable.
We know this pattern: it only shows up in an in-app WebView or on a specific device. Desktop browsers never quite match.
Squinting at the phone, windows never line up
My first reflex was the usual toolkit.
Remote debug: enable WebView debugging on Android, plug in USB, hunt the page in chrome://inspect. Sometimes it never appears—you need a debug build or confirmation it is not an X5 kernel. iOS is its own maze: Safari dev menu, certs, Web Inspector—and the connection drops when the page reloads.
vConsole / eruda: logs on the page, but you inject via code or proxy; the DOM tree on a small screen is painful for pixel-peeping.
Capture tools: Charles shows the H5 XHRs; request/response decrypt fine—but Network is one window, DOM and Console another. You spot a 500 on POST /api/xxx in the list, then switch back to the phone to see which UI triggered it; you align TypeError timestamps in Console with rows in capture by hand.
QA sent a screen recording: “This red button—no response.”
I stared at six inches of H5, capture on a second monitor, remote debug fighting on a third—none of them could tell me at once “this node on the page” and “the request it just fired” were the same story.
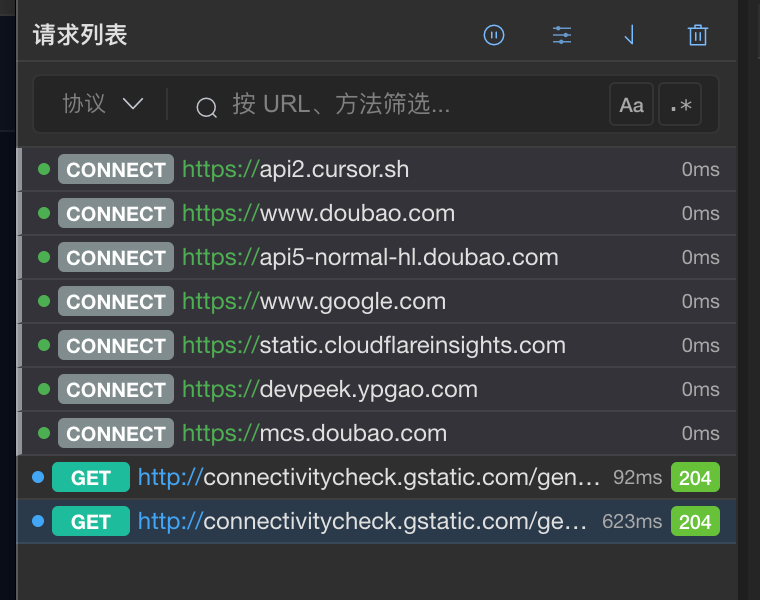
Capture shows the H5 requests—but DOM and Console still live on another screen.
The blocker was never “can’t see traffic”
Proxy and SSL were sorted in part one. What grinds H5 joint debug is: traffic is visible; page context lives somewhere else.
Responsive mode only resizes the viewport—it still runs desktop Chrome, not the in-app WebView. Remote debug is accurate when it connects, but without USB, a debug build, X5 quirks, or when iOS Web Inspector drops on reload, you are back to squinting at the phone.
DevPeek takes a different path: inject a debug script through the proxy and inspect DOM and Console in the real page’s JS context; Network shares the capture list, and Mock sits on the same proxy chain—change a response or error code, tap a button in the page, and the request hits your mocked result without switching tools.
We are not claiming “more faithful simulation than DevTools.” Injection is limited by CSP, injectable HTML, and the JS runtime; the mirror is rrweb replay, not a GPU video feed; soft keyboard, native chrome, and JSBridge are out of scope. What we optimize for is convenience—big-screen inspection with page and network (including Mock) in one place—and keeping going when remote debug will not connect.
Mirror in the Debug tab, inspect with our panels
Param transform owns encrypted bodies; for H5, DevPeek owns the page itself—mobile web debugging in the main window’s Debug tab.
Prerequisites match capture: phone on DevPeek’s proxy, root CA trusted, target hosts in SSL decrypt scope. See the checklist in mobile web debugging; miss a step and the preview stays on “Waiting for device connection.”
Once that holds, the flow is simple:
- Open the Debug tab and pick the test Android device in the top client tab (shared with Capture—one device, one tab).
- Reload or reopen the H5 page in the App. The proxy injects a debug script into the HTML; the page connects back over WebSocket and the left preview mirrors DOM and interaction in real time (rrweb record/replay—not a video stream of the whole page).
- Below are built-in debug panels—not embedded Chrome DevTools, but sections designed for proxied mirrors.
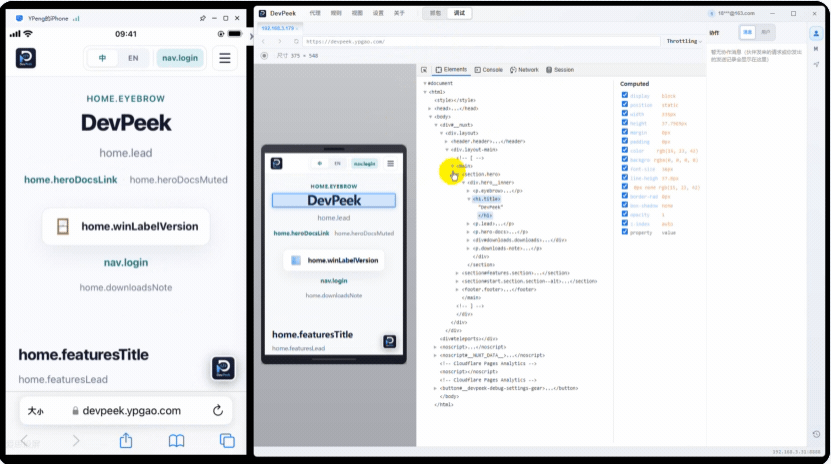
Once connected—inspect DOM, Console, and Network on a big screen without juggling remote debug.
Elements (DOM): the tree on the right shares the same source as the mirror. Turn on pick mode, click a node in the preview, the tree highlights it; style and DOM edits go to the real device, and the mirror updates via rrweb—you inspect on desktop, you change the phone.
Console: console.log and errors from the target page stream into the panel, filtered by page session so old tabs do not bleed logs. You can eval expressions in the real page context—like remote debug’s console, without wrestling chrome://inspect first.
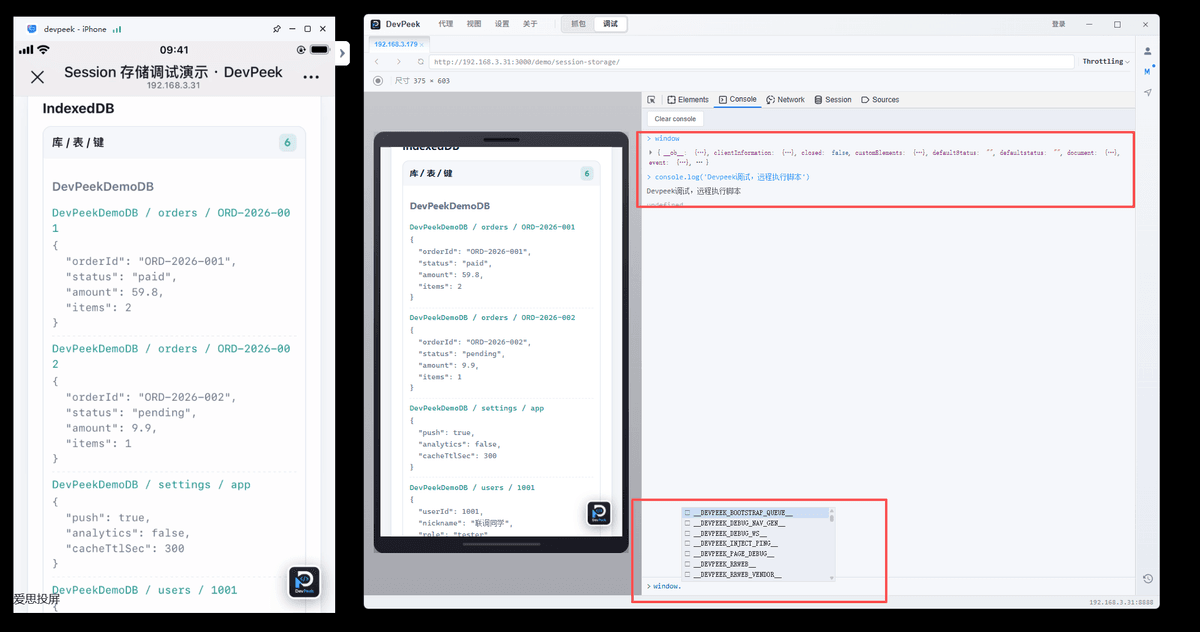
Console with autocomplete and remote eval—type expressions on a big screen while debugging.
Network: requests from the mirrored page, same source as the capture list—same proxy hops, same param transform and Mock rules. Encrypted bodies still show decrypted fields in details; after you Mock an activity API response, Network shows what the page actually received; to resend with edits, switch to Capture, select the row, open Debug API—no copy/paste into Postman.
Those three panels plus the toolbar (back / forward / reload, URL navigation, throttling) close the loop: inspect against the mirror. For limits (CSP, injection, mirror vs device), see mobile web debugging—use it when injection works; cross-check on the device when something does not line up.
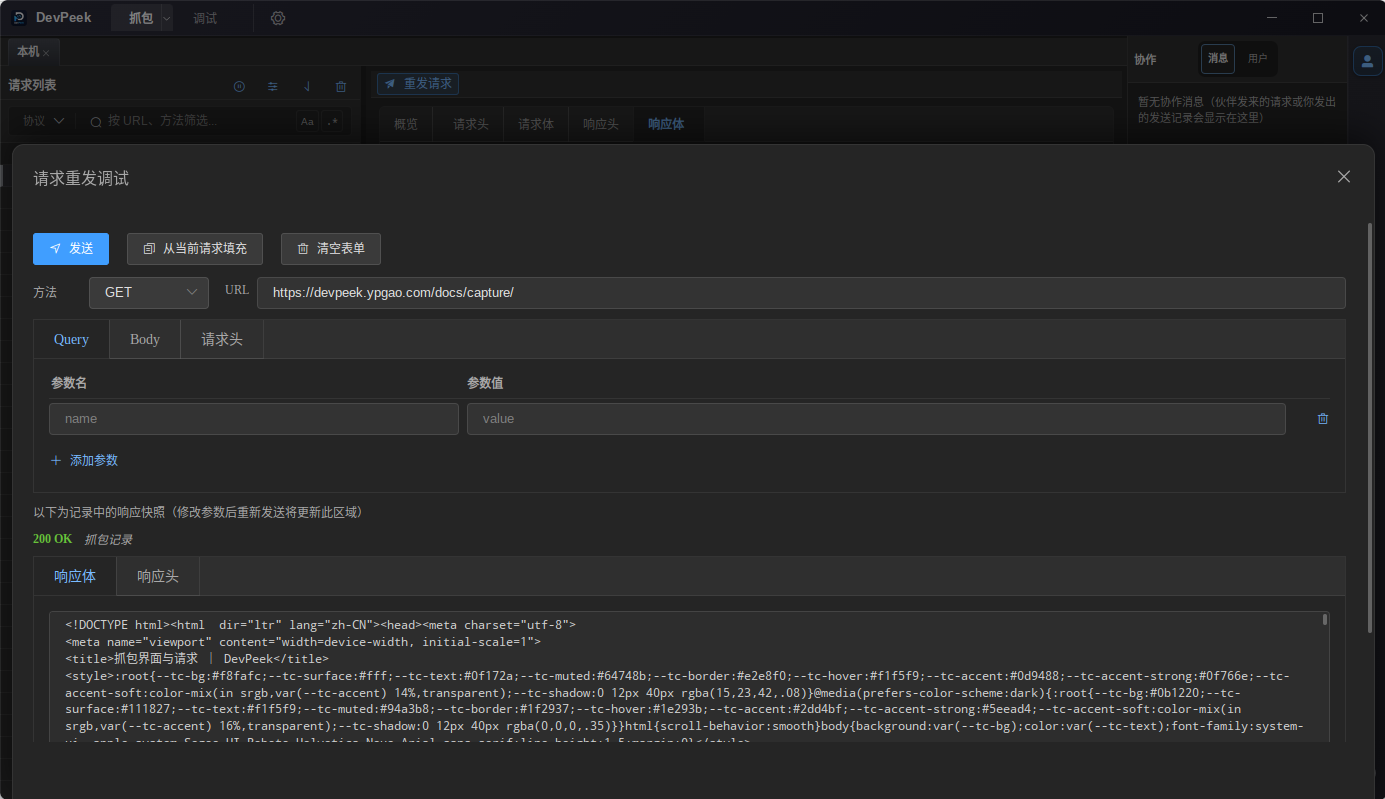
Switch to Capture, open Debug API on a row—edit fields and resend without leaving the proxy chain.
Map Route, Mock—same proxy chain
H5 joint debug often hits: the page hard-codes https://api.example.com while your service runs on 127.0.0.1:8080; or staging is not deployed yet and you need to see how the UI handles an error code.
When shipping H5 is not an option, Map Route points the host to a local stub; Mock rewrites the body or status—all on the proxy path, no URL change in the WebView. The Mock tamper dialog is not limited by client tab or main window tab: tap in the mirrored page on the Debug tab and the tamper UI still opens on hit; Network shares the same data source as the capture list. The Debug tab still mirrors the in-app page; tap in the mirror and you are exercising that same chain, not a second Charles or Postman setup just to align DOM with traffic.
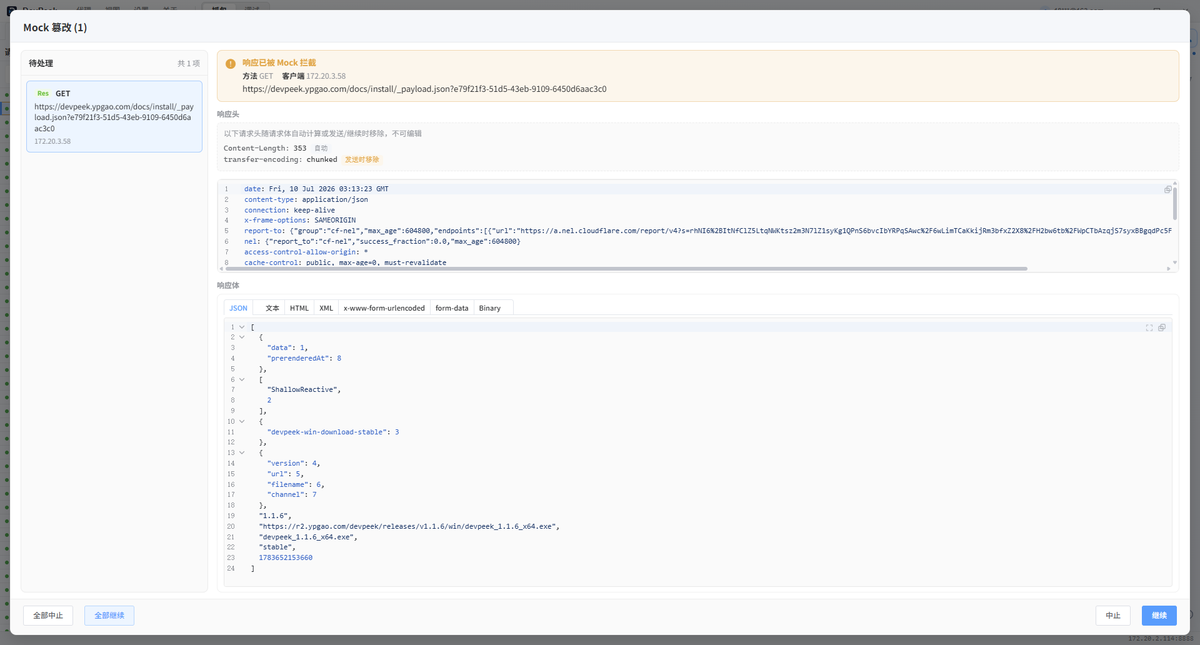
Same proxy chain—tap in the mirror, edit the response in the dialog, and the page receives the tampered result.
That activity button
Back to the button: pick mode in Elements showed the outer div’s padding-bottom computed short on Android WebView—responsive mode on desktop did not reproduce it; remote debug had not connected yet.
A quick getComputedStyle in Console, and Network confirmed POST /api/activity/join never fired on tap—not a bad API, a blocked hit area. After pushing the style fix to the device, QA clicked through on the mirror, then signed off in the App—no hunching over my desk with their phone.
If you are still squinting at in-app H5 on a tiny screen, try DevPeek or say hi on GitHub Discussions—setup: mobile web debugging, proxy and certs: proxy & SSL.